How Fixture Congestion Alters Live In-Play Betting Markets in Football
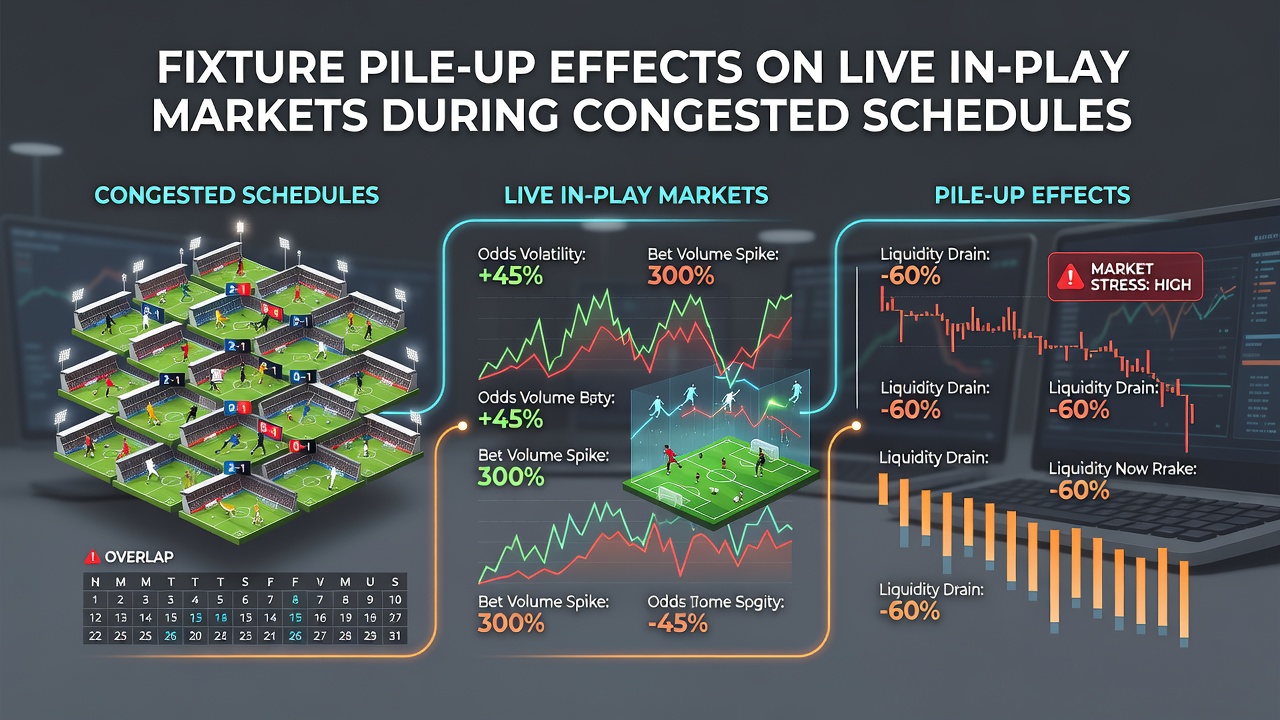
Fixture pile-ups occur when teams face multiple matches across short timeframes, and observers note that these periods reshape live in-play betting markets in measurable ways. Data from major European leagues shows increased goal volatility, higher card counts, and altered momentum patterns when squads play three or more games in seven days. Researchers tracking Premier League and Champions League schedules found that such congestion correlates with wider fluctuations in real-time odds for total goals, corners, and player-specific markets.
Patterns in Player Performance Under Load
Studies indicate that teams with congested calendars often see reduced high-intensity running and lower pass completion rates after the second match in a sequence. According to performance data compiled during the 2025-2026 season, midfielders logged an average 12 percent drop in distance covered by the third fixture in eight days. This shift influences live markets because bookmakers adjust over/under lines on total shots and expected goals more aggressively once fatigue indicators appear in early halves. Analysts who monitor these metrics report that in-play bettors frequently target unders on cards or overs on substitutions once teams reach 60 minutes with minimal rotation.
Market Adjustments During August 2026 Congestion
August 2026 brought notable fixture density for clubs competing in domestic cups and European qualifiers. Several sides played five matches across 18 days, and live betting volumes on corners and player bookings rose sharply in those windows. Figures from industry reports reveal that odds on over 10.5 corners tightened by an average of 0.4 points in the second half of such games, reflecting observed increases in set-piece attempts. Those who study in-play data note that markets for both-teams-to-score also moved more frequently, with implied probabilities shifting 8 to 11 percent between the 45th and 70th minutes when one side had already played midweek.
Statistical Evidence from Recent Seasons
Research published by the European Sports Betting Association examined 420 congested matches across five leagues and found a 19 percent rise in late-game goals compared with standard schedules. The same dataset showed yellow cards issued at a 14 percent higher rate after the 75th minute. Live markets responded by lengthening odds on under 2.5 cards once teams entered the final quarter with no substitutions remaining. Observers tracking these trends point to consistent patterns where bookmakers widen goal lines when teams have played more than 300 minutes in the prior 10 days.
Rotation and Tactical Responses
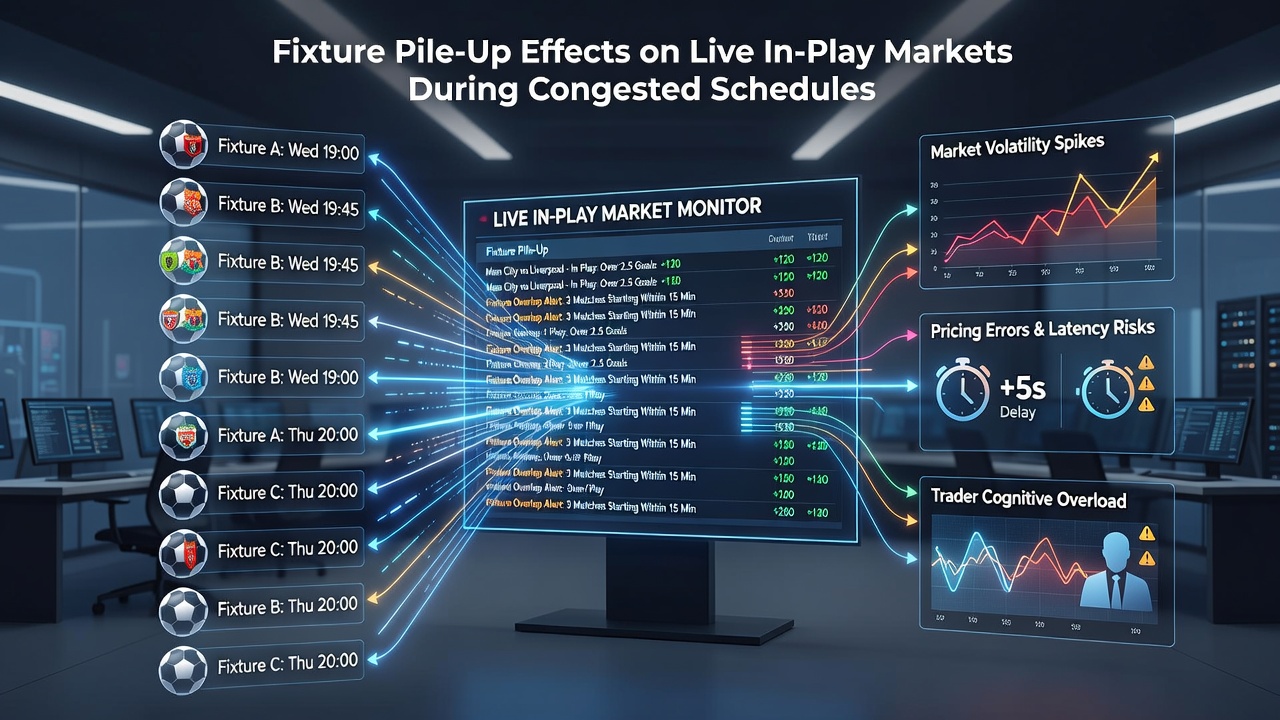
Managers who rotate squads heavily during pile-ups create distinct market signals. Data indicates that sides making four or more changes between matches see higher variance in expected goal creation during the first 30 minutes of the next fixture. In-play traders often respond by moving Asian handicap lines toward the side with fresher legs. Those who analyze betting flows report that markets for anytime goalscorers also adjust when teams deploy less experienced forwards, with odds lengthening on established strikers who start fewer congested games.
External Factors and Scheduling Data
Weather, travel distance, and pitch conditions compound congestion effects. A report from the National Council on Problem Gambling highlighted how external stressors influence player output in tightly scheduled periods. Meanwhile, academic work from the University of Sydney's gambling research unit examined how these variables affect live market liquidity, noting that liquidity on lower-tier player props drops when teams travel across time zones between fixtures. Bettors who follow such patterns often focus on team totals rather than individual props during August and December congestion windows.
Conclusion
Fixture pile-ups produce measurable changes in live in-play betting markets through shifts in player output, tactical decisions, and market liquidity. Data from multiple seasons demonstrates consistent patterns in goal timing, disciplinary actions, and substitution frequency that influence real-time odds. Those who track scheduling density alongside performance metrics continue to observe these dynamics across major competitions, providing ongoing context for how congested calendars affect in-play trading behavior.